Welcome to the Impact Reporting Tip Series! As a Minnesota Public Benefit Corporation, we report every year on our impact for staff, clients, project stakeholders, and the broader community. Impact measurement and reporting can be an essential accountability and transparency tool for organizations working towards a social impact or a greater good. It can also be a great communication tool for investors, clients, and customers—they can be assured that by working with you their investments are in good hands.
As we prepare our report in time for Minnesota’s March 31 deadline, we are highlighting impact measurement and reporting as a way we and our fellow social enterprises can raise the bar. Follow this series for weekly updates on our progress to get tips to help you through the impact reporting process!
Impact report countdown: 1 week out!
Week 1: Aligning your work to areas of impact
As a first step in our impact reporting process, we are focusing on aligning our work to the UN Sustainable Development Goals (SDGs). At IG, we did this by involving all staff in mapping our 2019 projects to each relevant SDG. We wrote all over our (dry erase) walls and came up with a great list to help us see which goals our work is moving towards! Stay tuned in further weeks for how we move this list into describing our ripple effect impact.
Try this in your work by determining what SDG(s) are relevant to your social enterprise!
Week 2: Selecting IRIS Indicators
Now that we have aligned our 2019 project work with the UN Sustainable Development Goals (SDGs), we are focusing on selecting IRIS+ metrics and indicators to support consistency in how impact claims are reported and measured. At IG, we did this by pulling a comprehensive IRIS+ list of Cross-Category metrics (n=140), and asked all of our staff to “vote” on what measures were most important and relevant to our work as a Public Benefit Corporation. A small committee then analyzed the results to further prioritize and categorize which indicators align best with our impact goals.
Explore the list of IRIS+ metrics and see if you can determine which are most relevant to your work! And don't forget to include input from your colleagues and stakeholders in your decision-making process - it will make your impact report all the more meaningful.
Week 3: Aggregating data and matching it to your indicators
This week, we are gathering and aggregating data that matches to our identified indicators. For The Improve Group, this means looking back through our records to analyze impact related to our:
- Employees: We are looking at demographics, hiring and retention, work hours spent volunteering and donation dollars matched.
- Vendors: We are looking at the percentage of our dollars we spent in local businesses, those owned by people of color or women, and those that are social enterprises.
- Customers: All of our customers are mission-focused (i.e., public sector; NGOs); we are analyzing their missions and the people they serve.
- Community: We are gathering data about how we engaged community members and how our work was used by communities.
- Sustainability: We have data about our water use, and are noting practices to save energy and reduce waste.
Where is this data coming from? Employee and financial records are particularly valuable sources of data; a secondary source of data are purchase orders, contracts, requests for proposals we responded to, and feedback we received from customers. What other data is relevant to your social enterprise? We'd love to hear from you as you are thinking through potential sources and how they might match to your indicators!
Week 4: Vetting your data with staff
After aggregating our data and matching it to our indicators, we then focused on pulling together a report outline and vetting our data with our staff. At IG, we did this by hosting a meeting to present the data we pulled and facilitate staff to process through it. Staff let us know what was missing and where we could dive deeper for a more meaningful report.
What have you done to be responsive to your employees and stakeholders as you develop your report? It’s always great to get multiple opinions from those who have stake in the data to help enhance what you are learning!
Week 5: Harvesting findings from data to learn about your impact
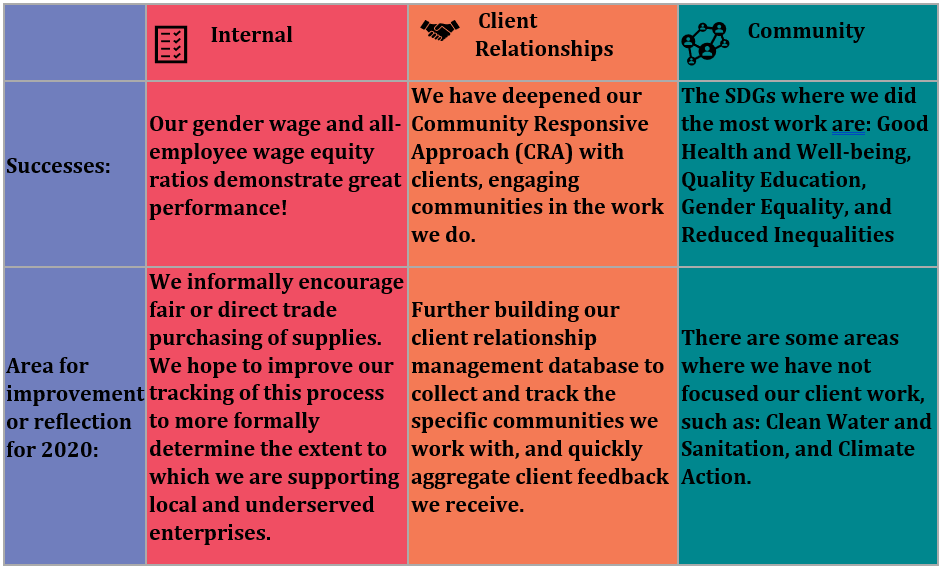
After diving further into our data over the previous couple of weeks, we began to do some analysis to learn more about our impact. As themes began to emerge in different areas, we decided to map our impact into three categories: internal, through client relationships, and in communities. Here are examples of where we think we are being most successful and one area we aim to improve in each category:
What impacts are you learning about for your organization? What about lessons learned for improving your impact in future years? We look forward to seeing what you’re learning and can’t wait to detail more about our learnings when we release our final report next week!
Week 6: Illustrating the story of your impact
The final step in our impact report development process was taking our most impactful learnings/data and integrating them into a report that tells our story through a compelling and easy to understand format. We did this by organizing the report structure in a way that mirrored the impact themes that emerged during analysis: (1) internal, (2) client, and (3) community impact. Once the content was laid out, we applied meaningful graphics and visuals to bolster the report design and highlight The Improve Group’s brand.
You can check out our final report here!
Thank you all for tuning in to our weekly impact reporting series! We hope this helped spur some new ideas and insights as you aim to measure your impact in the years to come. If you'd be interested in exploring more ideas, give us a shout! Now go get out there and continue to build the fabulous impact work you do.