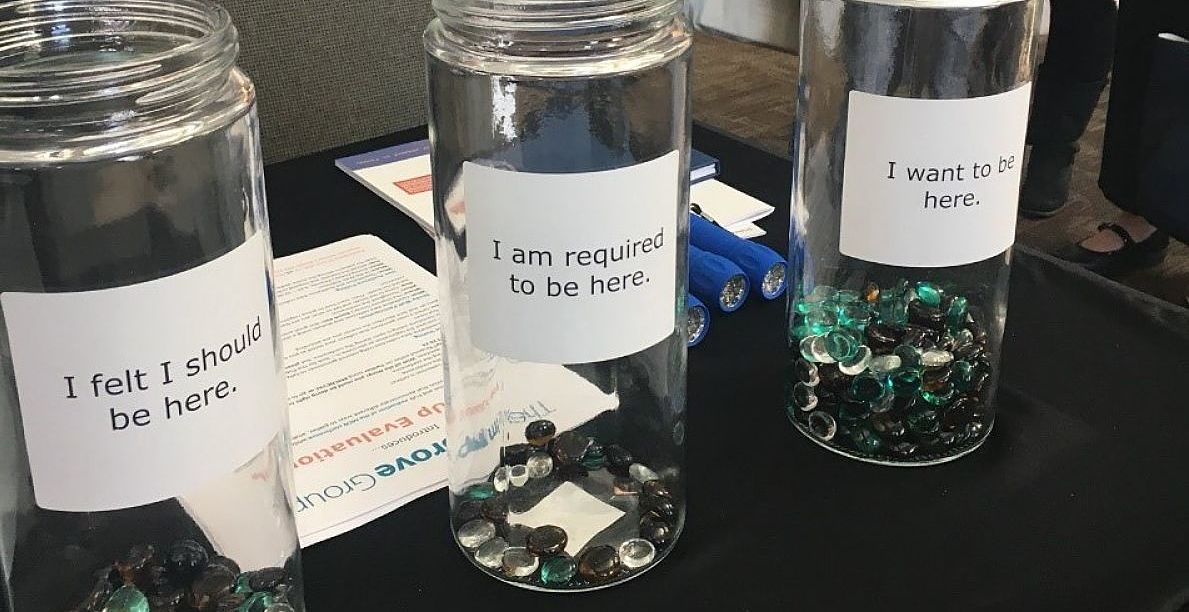
We love helping others see how evaluation is fun and accessible, like with participatory activities for data collection. One way to do this, especially in evaluating an event, is to do a real-time, live “pop-up” evaluation! We took this approach at the Minnesota Council of Nonprofits’ Annual Conference last October. Some of you may remember participating: did you drop a gemstone in a jar, or write an answer to a question and put it on our big green “sticky wall?” For this event, we embedded various data collection methods into the conference, including the gemstone entry poll, where different colors of gems represented different emotions, and different jars represented people’s reasons for attending – it was a cross-tabulation of results right before your eyes! At our booth in the exhibitor hall, we asked passersby what they were learning and what they wanted to learn. And during a conference keynote, we engaged people with a simple, app-based poll about diversity and inclusion.
As with any evaluation approach, it’s important to keep some things in mind when going live with data collection:
Collaborate closely ahead of time
When an evaluation is conducted in real time, the planning and preparation in the weeks and months leading up to the event are critical! IG interns John Wilson and Messan Agbemadon, who led this project, studied the logistics of the conference and worked closely with MCN in the design phase. MCN staff provided their deep insight from years of experience hosting the conference. “We had to figure out how to turn broad evaluation questions into activities that were easy to understand and that gave us solid responses,” John said. “We went through several rounds of tweaking the wording to ensure participants had clear understanding of what we were asking.”
Think (evaluatively) on your feet
At the same time, be flexible—you will find ways to improve the process by doing it. This is the fun part! For example, at the entry poll, we found that certain ways of asking people to participate worked better than others, and we shared these insights across our team. Then, when we wanted to share a handout explaining the keynote poll but weren’t reaching enough people, we took a pile of handouts and stood by the entrance of the conference room to catch people on their way in.
Bulk up your data
You aren’t limited to the live event data – offer attendees a post-event survey to augment what you learn during the on-site evaluation. You’ll also capture thoughts from those you didn’t reach at the event.
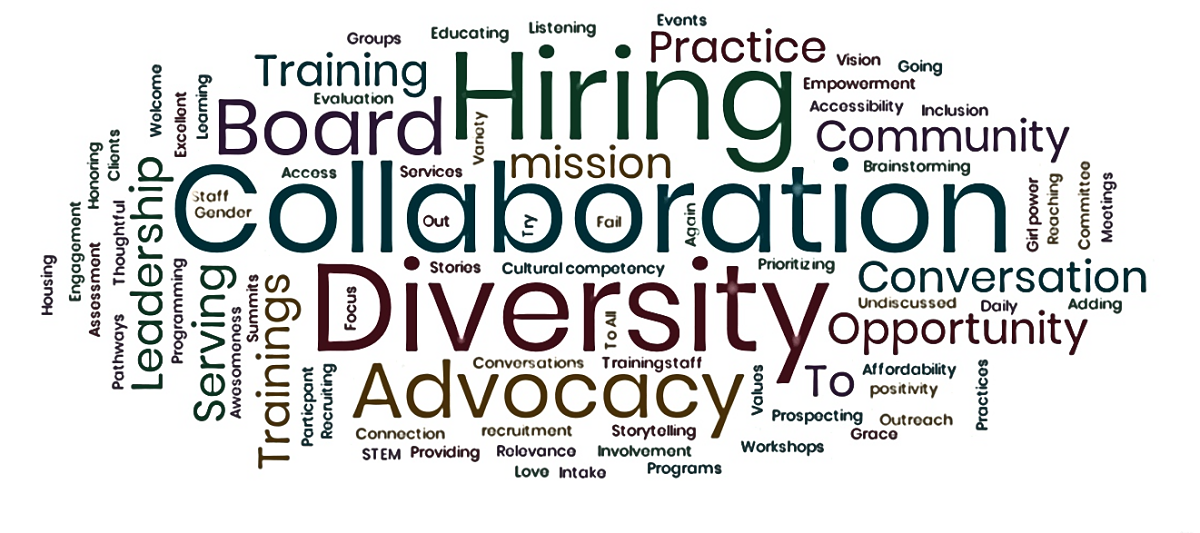
Thanks to MCN attendees for participating and for your excitement to see the results— the wait is over! We cross-tabulated what gemstones were in which jars to find any connections between how people were feeling and why they were there. By far, the most popular reason for attending was that participants wanted to be there (244 people)! Of these participants, most (105) were excited, 74 were curious, 49 were calm, and 16 were anxious. In the keynote poll, we asked how nonprofits were engaging in equity and inclusion work, with most responses centering around hiring, collaboration, and diversity. We also asked attendees how helpful the conference had been for this equity and inclusion work, and the average response was favorable: 4 out of 5. Thanks to everyone who participated in our activities—we hope you had as much fun as we did!